Geschäftsentwicklung in den Segmenten
Überblick
Segmente im Überblick (Millionen €) |
|||||||||
|
|
Umsatz |
Ergebnis der Betriebstätigkeit vor Abschreibungen (EBITDA) |
Ergebnis der Betriebstätigkeit (EBIT) vor Sondereinflüssen |
|||||
|---|---|---|---|---|---|---|---|---|---|
|
|
2016 |
2015 |
2016 |
2015 |
2016 |
2015 |
||
|
|||||||||
Chemicals |
|
13.461 |
14.670 |
3.169 |
3.090 |
2.064 |
2.156 |
||
Performance Products |
|
15.002 |
15.648 |
2.522 |
2.289 |
1.745 |
1.366 |
||
Functional Materials & Solutions |
|
18.732 |
18.523 |
2.906 |
2.228 |
1.946 |
1.649 |
||
Agricultural Solutions |
|
5.569 |
5.820 |
1.305 |
1.321 |
1.087 |
1.090 |
||
Oil & Gas |
|
2.768 |
12.998 |
1.596 |
2.587 |
517 |
1.366 |
||
Sonstige |
|
2.018 |
2.790 |
–972 |
–866 |
–1.050 |
–888 |
||
|
|
57.550 |
70.449 |
10.526 |
10.649 |
6.309 |
6.739 |
||
|
|
|
|
|
|
|
|
||
|
|
Ergebnis der Betriebstätigkeit (EBIT) |
Vermögen |
Investitionen 1 |
|||||
|
|
2016 |
2015 |
2016 |
2015 |
2016 |
2015 |
||
Chemicals |
|
1.983 |
2.131 |
13.486 |
12.823 |
1.213 |
1.859 |
||
Performance Products |
|
1.648 |
1.340 |
14.549 |
14.232 |
864 |
964 |
||
Functional Materials & Solutions |
|
2.199 |
1.607 |
17.359 |
13.341 |
3.679 |
854 |
||
Agricultural Solutions |
|
1.037 |
1.083 |
8.899 |
8.435 |
266 |
402 |
||
Oil & Gas |
|
499 |
1.072 |
12.829 |
12.373 |
1.115 |
1.823 |
||
Sonstige |
|
–1.091 |
–985 |
9.374 |
9.632 |
121 |
111 |
||
|
|
6.275 |
6.248 |
76.496 |
70.836 |
7.258 |
6.013 |
||
Anteile der Segmente
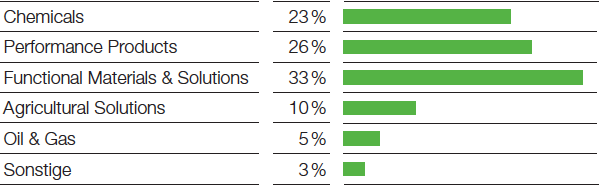
Anteil der Segmente am Umsatz
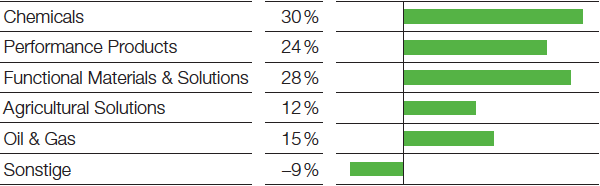
Anteil der Segmente am EBITDA
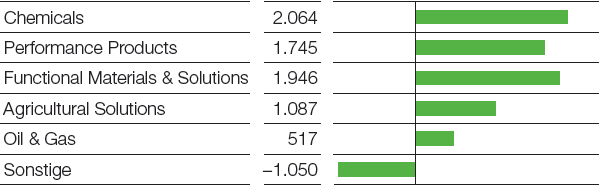
EBIT vor Sondereinflüssen der Segmente
(Millionen €)
Entwicklung nach Quartalen
Umsatz 1 (Millionen €) |
|||||||||||
|
|
1. Quartal |
2. Quartal |
3. Quartal |
4. Quartal |
||||||
|---|---|---|---|---|---|---|---|---|---|---|---|
|
|
2016 |
2015 |
2016 |
2015 |
2016 |
2015 |
2016 |
2015 |
||
|
|||||||||||
Chemicals |
|
3.149 |
3.866 |
3.373 |
3.975 |
3.377 |
3.640 |
3.562 |
3.189 |
||
Performance Products |
|
3.783 |
4.038 |
3.846 |
4.084 |
3.771 |
3.899 |
3.602 |
3.627 |
||
Functional Materials & Solutions |
|
4.408 |
4.584 |
4.703 |
4.916 |
4.660 |
4.517 |
4.961 |
4.506 |
||
Agricultural Solutions |
|
1.780 |
1.898 |
1.459 |
1.678 |
1.049 |
1.077 |
1.281 |
1.167 |
||
Oil & Gas |
|
611 |
4.993 |
617 |
3.668 |
618 |
3.606 |
922 |
731 |
||
Sonstige |
|
477 |
688 |
485 |
757 |
538 |
685 |
518 |
660 |
||
|
|
14.208 |
20.067 |
14.483 |
19.078 |
14.013 |
17.424 |
14.846 |
13.880 |
||
Ergebnis der Betriebstätigkeit (EBIT) vor Sondereinflüssen 1 (Millionen €) |
|||||||||||
|
|
1. Quartal |
2. Quartal |
3. Quartal |
4. Quartal |
||||||
|---|---|---|---|---|---|---|---|---|---|---|---|
|
|
2016 |
2015 |
2016 |
2015 |
2016 |
2015 |
2016 |
2015 |
||
|
|||||||||||
Chemicals |
|
465 |
726 |
467 |
548 |
497 |
633 |
635 |
249 |
||
Performance Products |
|
547 |
515 |
503 |
304 |
464 |
319 |
231 |
228 |
||
Functional Materials & Solutions |
|
456 |
431 |
535 |
458 |
497 |
371 |
458 |
389 |
||
Agricultural Solutions |
|
591 |
574 |
320 |
365 |
97 |
7 |
79 |
144 |
||
Oil & Gas |
|
66 |
437 |
94 |
431 |
194 |
371 |
163 |
127 |
||
Sonstige |
|
–219 |
–613 |
–212 |
–63 |
–233 |
–98 |
–386 |
–114 |
||
|
|
1.906 |
2.070 |
1.707 |
2.043 |
1.516 |
1.603 |
1.180 |
1.023 |
||
Ergebnis der Betriebstätigkeit (EBIT) 1 (Millionen €) |
|||||||||||
|
|
1. Quartal |
2. Quartal |
3. Quartal |
4. Quartal |
||||||
|---|---|---|---|---|---|---|---|---|---|---|---|
|
|
2016 |
2015 |
2016 |
2015 |
2016 |
2015 |
2016 |
2015 |
||
|
|||||||||||
Chemicals |
|
468 |
726 |
467 |
548 |
499 |
631 |
549 |
226 |
||
Performance Products |
|
535 |
491 |
486 |
368 |
458 |
315 |
169 |
166 |
||
Functional Materials & Solutions |
|
452 |
464 |
531 |
411 |
492 |
366 |
724 |
366 |
||
Agricultural Solutions |
|
590 |
573 |
288 |
365 |
93 |
6 |
66 |
139 |
||
Oil & Gas |
|
66 |
436 |
93 |
430 |
178 |
643 |
162 |
–437 |
||
Sonstige |
|
–245 |
–695 |
–147 |
–83 |
–256 |
–72 |
–443 |
–135 |
||
|
|
1.866 |
1.995 |
1.718 |
2.039 |
1.464 |
1.889 |
1.227 |
325 |
||
EBIT vor Sondereinflüssen der BASF-Gruppe nach Quartalen 1
(Millionen €)
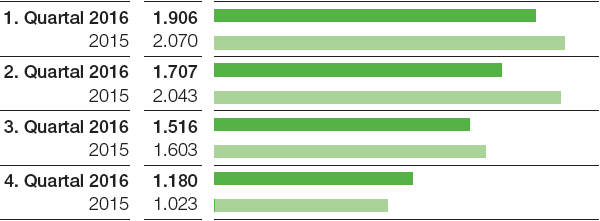
1 Quartalswerte stellen ungeprüfte Zusatzinformationen dar.