Performance Products
2nd Quarter 2017
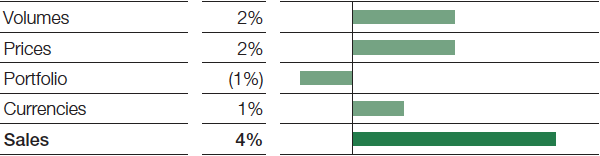
Sales in the Performance Products segment slightly exceeded the previous second quarter’s level. This was largely attributable to price increases, through which we were only partly able to compensate for higher raw material prices. Volumes grew slightly in all divisions. Currency effects had a positive impact on sales; portfolio effects slowed sales development. Ongoing margin pressure, mostly from rising raw material prices as well as challenging market conditions in individual business areas, led to a considerable decline in income from operations (EBIT) before special items.
Factors influencing sales, Performance Products
2nd Quarter 2017
Dispersions & Pigments
In the Dispersions & Pigments division, we achieved considerably higher sales compared with the previous second quarter. This was especially attributable to higher prices driven up by increased raw material prices, as well as to growth in sales volumes. We raised sales volumes in nearly every business area. In the pigments business, volumes were slightly below the high level of the prior second quarter. Currency effects had a positive influence on sales development. Compared with the second quarter of 2016, EBIT before special items declined slightly, mainly due to shrunken margins owing to higher raw material prices.
Care Chemicals
Sales in the Care Chemicals division rose considerably compared with the second quarter of 2016, predominantly driven by price increases resulting from higher raw material prices. Volumes growth and positive currency effects additionally boosted sales. We raised sales volumes in our hygiene business as well as in our business with ingredients for the detergents and cleaners industry. EBIT before special items fell considerably compared with the same quarter of the previous year. This was largely a consequence of lower margins for oleochemical surfactants and fatty alcohols. Competition remained intense in the hygiene business.
Nutrition & Health
Sales in the Nutrition & Health division were considerably below prior second-quarter levels, mainly due to portfolio effects. The slight decline in sales prices was mostly a result of decreased vitamin prices in the animal nutrition business. Currency effects and higher volumes in our flavor and fragrance business, as well as in human nutrition, provided support for sales development. EBIT before special items fell considerably compared with the second quarter of 2016. This was mostly on account of lower margins in the animal nutrition business as well as higher fixed costs arising from the gradual startup of new plants.
Performance Chemicals
In the Performance Chemicals division, sales rose slightly year-on-year. This was largely thanks to a recovery in demand for oilfield chemicals as well as for lubricants and additives in North America. Higher overall sales volumes and positive currency effects were contrasted by slight decreases in sales prices. Lower margins, pushed down by higher raw material prices, were only partly compensated by reduced fixed costs and resulted in EBIT before special items at a level considerably below that of the second quarter of 2016.
|
|
2nd Quarter |
1st Half |
||||||||||
|---|---|---|---|---|---|---|---|---|---|---|---|---|---|
|
|
2017 |
2016 |
Change % |
2017 |
2016 |
Change % |
||||||
|
|||||||||||||
Sales to third parties |
|
4,142 |
3,983 |
4 |
8,402 |
7,896 |
6 |
||||||
Thereof Dispersions & Pigments |
|
1,435 |
1,350 |
6 |
2,834 |
2,616 |
8 |
||||||
Care Chemicals |
|
1,263 |
1,178 |
7 |
2,625 |
2,382 |
10 |
||||||
Nutrition & Health |
|
464 |
497 |
(7) |
950 |
985 |
(4) |
||||||
Performance Chemicals |
|
980 |
958 |
2 |
1,993 |
1,913 |
4 |
||||||
Income from operations before depreciation and amortization (EBITDA) |
|
609 |
706 |
(14) |
1,323 |
1,464 |
(10) |
||||||
Amortization and depreciation2 |
|
246 |
211 |
17 |
461 |
426 |
8 |
||||||
Income from operations (EBIT) |
|
363 |
495 |
(27) |
862 |
1,038 |
(17) |
||||||
Special items |
|
(42) |
(17) |
. |
(58) |
(29) |
(100) |
||||||
EBIT before special items |
|
405 |
512 |
(21) |
920 |
1,067 |
(14) |
||||||
Assets (June 30) |
|
14,840 |
14,858 |
0 |
14,840 |
14,858 |
0 |
||||||
Investments including acquisitions3 |
|
160 |
196 |
(18) |
373 |
376 |
(1) |
||||||
Research and development expenses |
|
97 |
97 |
– |
190 |
196 |
(3) |
||||||